Using SQL Patch To Inject Hints

In my previous post (Execution Plans, Hints and Outlines in Oracle 18c) we saw how to use a SQL Hint to modify the order in which the CBO joins the tables. Today I want to show you a cool feature to inject this change without re-writing your SQL statement.
Let’s use the same SQL statement:
explain plan SET statement_id = ‘ex_plan’ for SELECT
    COUNT(*)
FROM
    hr.employees a,
    hr.departments b,
    hr.locations c
WHERE
    a.department_id = b.department_id
    AND b.location_id = c.location_id
    AND a.salary > 3000
    AND c.postal_code IS NOT NULL;
SELECT PLAN_TABLE_OUTPUT
  FROM TABLE(DBMS_XPLAN.DISPLAY(NULL, ‘ex_plan’,’ADVANCED’));
PLAN_TABLE_OUTPUT                                                                                                                                                                                                                                                                                           
————————————————————————————————————————————————————————————————————————————————————————————————————
Plan hash value: 3098668569
—————————————————————————————————
| Id  | Operation                      | Name             | Rows  | Bytes | Cost (%CPU)| Time     |
—————————————————————————————————
|   0 | SELECT STATEMENT               |                  |     1 |    24 |     8  (13)| 00:00:01 |
|   1 |  SORT AGGREGATE                |                  |     1 |    24 |            |          |
|*  2 |   HASH JOIN                    |                  |    80 |  1920 |     8  (13)| 00:00:01 |
|   3 |    MERGE JOIN                  |                  |    27 |   459 |     5  (20)| 00:00:01 |
|*  4 |     TABLE ACCESS BY INDEX ROWID| LOCATIONS        |    22 |   220 |     2   (0)| 00:00:01 |
|   5 |      INDEX FULL SCAN           | LOC_ID_PK        |    23 |       |     1   (0)| 00:00:01 |
|*  6 |     SORT JOIN                  |                  |    27 |   189 |     3  (34)| 00:00:01 |
|   7 |      VIEW                      | index$_join$_002 |    27 |   189 |     2   (0)| 00:00:01 |
|*  8 |       HASH JOIN                |                  |       |       |            |          |
|   9 |        INDEX FAST FULL SCAN    | DEPT_ID_PK       |    27 |   189 |     1   (0)| 00:00:01 |
|  10 |        INDEX FAST FULL SCAN    | DEPT_LOCATION_IX |    27 |   189 |     1   (0)| 00:00:01 |
|* 11 |    TABLE ACCESS FULL           | EMPLOYEES        |    81 |   567 |     3   (0)| 00:00:01 |
—————————————————————————————————
Query Block Name / Object Alias (identified by operation id):
————————————————————-
   1 – SEL$1      
   4 – SEL$1        / C@SEL$1
   5 – SEL$1        / C@SEL$1
   7 – SEL$FD64DD72 / B@SEL$1
   8 – SEL$FD64DD72
   9 – SEL$FD64DD72 / indexjoin$_alias$_001@SEL$FD64DD72
  10 – SEL$FD64DD72 / indexjoin$_alias$_002@SEL$FD64DD72
  11 – SEL$1        / A@SEL$1
Outline Data
————-
  /*+
      BEGIN_OUTLINE_DATA
      USE_HASH(@”SEL$1″ “A”@”SEL$1”)
      USE_MERGE(@”SEL$1″ “B”@”SEL$1”)
      LEADING(@”SEL$1″ “C”@”SEL$1” “B”@”SEL$1” “A”@”SEL$1”)
      FULL(@”SEL$1″ “A”@”SEL$1”)
      INDEX_JOIN(@”SEL$1″ “B”@”SEL$1” (“DEPARTMENTS”.”DEPARTMENT_ID”)
              (“DEPARTMENTS”.”LOCATION_ID”))
      INDEX(@”SEL$1″ “C”@”SEL$1” (“LOCATIONS”.”LOCATION_ID”))
      OUTLINE_LEAF(@”SEL$1″)
      OUTLINE_LEAF(@”SEL$FD64DD72″)
      ALL_ROWS
      DB_VERSION(‘18.1.0’)
      OPTIMIZER_FEATURES_ENABLE(‘18.1.0’)
      IGNORE_OPTIM_EMBEDDED_HINTS
      END_OUTLINE_DATA
  */
The idea is to use the Hint /*+ LEADING(@”SEL$1″ “A”@”SEL$1” “B”@”SEL$1” “C”@”SEL$1”) */ without the need to actually write it into the SQL text.

In order to do this, Oracle provides a procedure called DBMS_SQLDIAG.CREATE_SQL_PATCH. 
We can invoke it using the SQL text or the SQL_ID of our statement. 

In my example, I’m going to use the SQL_ID 8b2gpq57hxdws.

Here will be the syntax to create the SQL patch:

DECLARE
  patch_name  VARCHAR2(32767);
BEGIN
  patch_name := SYS.DBMS_SQLDIAG.create_sql_patch(
    sql_id    => ‘8b2gpq57hxdws’,
    hint_text => ‘LEADING(@”SEL$1″ “A”@”SEL$1” “B”@”SEL$1” “C”@”SEL$1”)’,
    name      => ‘TEST_PATCH’);
END;
/
PL/SQL procedure successfully completed.
Now, let’s get the execution plan again:

explain plan SET statement_id = ‘ex_plan’ for SELECT
    COUNT(*)
FROM
    hr.employees a,
    hr.departments b,
    hr.locations c
WHERE
    a.department_id = b.department_id
    AND b.location_id = c.location_id
    AND a.salary > 3000
    AND c.postal_code IS NOT NULL;
SELECT PLAN_TABLE_OUTPUT
  FROM TABLE(DBMS_XPLAN.DISPLAY(NULL, ‘ex_plan’,’ADVANCED’));
PLAN_TABLE_OUTPUT                                                                                                                                                                                                                                                                                           
————————————————————————————————————————————————————————————————————————————————————————————————————
Plan hash value: 2122977163
———————————————————————————————-
| Id  | Operation                 | Name             | Rows  | Bytes | Cost (%CPU)| Time     |
———————————————————————————————-
|   0 | SELECT STATEMENT          |                  |     1 |    24 |     8   (0)| 00:00:01 |
|   1 |  SORT AGGREGATE           |                  |     1 |    24 |            |          |
|*  2 |   HASH JOIN               |                  |    80 |  1920 |     8   (0)| 00:00:01 |
|*  3 |    HASH JOIN              |                  |    80 |  1120 |     5   (0)| 00:00:01 |
|*  4 |     TABLE ACCESS FULL     | EMPLOYEES        |    81 |   567 |     3   (0)| 00:00:01 |
|   5 |     VIEW                  | index$_join$_002 |    27 |   189 |     2   (0)| 00:00:01 |
|*  6 |      HASH JOIN            |                  |       |       |            |          |
|   7 |       INDEX FAST FULL SCAN| DEPT_ID_PK       |    27 |   189 |     1   (0)| 00:00:01 |
|   8 |       INDEX FAST FULL SCAN| DEPT_LOCATION_IX |    27 |   189 |     1   (0)| 00:00:01 |
|*  9 |    TABLE ACCESS FULL      | LOCATIONS        |    22 |   220 |     3   (0)| 00:00:01 |
———————————————————————————————-
Query Block Name / Object Alias (identified by operation id):
————————————————————-
   1 – SEL$1      
   4 – SEL$1        / A@SEL$1
   5 – SEL$FD64DD72 / B@SEL$1
   6 – SEL$FD64DD72
   7 – SEL$FD64DD72 / indexjoin$_alias$_001@SEL$FD64DD72
   8 – SEL$FD64DD72 / indexjoin$_alias$_002@SEL$FD64DD72
   9 – SEL$1        / C@SEL$1
Outline Data
————-
  /*+
      BEGIN_OUTLINE_DATA
      USE_HASH(@”SEL$1″ “C”@”SEL$1”)
      USE_HASH(@”SEL$1″ “B”@”SEL$1”)
      LEADING(@”SEL$1″ “A”@”SEL$1” “B”@”SEL$1” “C”@”SEL$1”)
      FULL(@”SEL$1″ “C”@”SEL$1”)
      INDEX_JOIN(@”SEL$1″ “B”@”SEL$1” (“DEPARTMENTS”.”DEPARTMENT_ID”)
              (“DEPARTMENTS”.”LOCATION_ID”))
      FULL(@”SEL$1″ “A”@”SEL$1”)
      OUTLINE_LEAF(@”SEL$1″)
      OUTLINE_LEAF(@”SEL$FD64DD72″)
      ALL_ROWS
      DB_VERSION(‘18.1.0’)
      OPTIMIZER_FEATURES_ENABLE(‘18.1.0’)
      IGNORE_OPTIM_EMBEDDED_HINTS
      END_OUTLINE_DATA
  */
Pretty cool, right?

As always, this is not the ultimate solution but it may buys us time to have the vendor or developers fix the code (hahaha, is not a joke!!!).

Anyway, another tool to keep in our radar after migrations, upgrades and major patches.

Thanks,
Alfredo

Execution Plans, Hints and Outlines in Oracle 18c

Today’s post is about execution plans. This quick example using the HR sample schema, highlights the importance of using SQL Hints to influence the execution path.
Let me use below SQL as an example:
SELECT
    COUNT(*)
FROM
    hr.employees a,
    hr.departments b,
    hr.locations c
WHERE
    a.department_id = b.department_id
    AND b.location_id = c.location_id
    AND a.salary > 3000
    AND c.postal_code IS NOT NULL;
  COUNT(*)
———-
        79
Let me also produce the explain plan for this SQL using the ‘ADVANCED’ format:
explain plan SET statement_id = ‘ex_plan’ for SELECT
    COUNT(*)
FROM
    hr.employees a,
    hr.departments b,
    hr.locations c
WHERE
    a.department_id = b.department_id
    AND b.location_id = c.location_id
    AND a.salary > 3000
    AND c.postal_code IS NOT NULL;
SELECT PLAN_TABLE_OUTPUT
  FROM TABLE(DBMS_XPLAN.DISPLAY(NULL, ‘ex_plan’,’ADVANCED’));
Explained.
PLAN_TABLE_OUTPUT
                                                                                                                                                                  ——————————————————————————————————————————-
Plan hash value: 3098668569
—————————————————————————————————
| Id  | Operation                      | Name             | Rows  | Bytes | Cost (%CPU)| Time     |
—————————————————————————————————
|   0 | SELECT STATEMENT               |                  |     1 |    24 |     8  (13)| 00:00:01 |
|   1 |  SORT AGGREGATE                |                  |     1 |    24 |            |          |
|*  2 |   HASH JOIN                    |                  |   102 |  2448 |     8  (13)| 00:00:01 |
|   3 |    MERGE JOIN                  |                  |    27 |   459 |     5  (20)| 00:00:01 |
|*  4 |     TABLE ACCESS BY INDEX ROWID| LOCATIONS        |    22 |   220 |     2   (0)| 00:00:01 |
|   5 |      INDEX FULL SCAN           | LOC_ID_PK        |    23 |       |     1   (0)| 00:00:01 |
|*  6 |     SORT JOIN                  |                  |    27 |   189 |     3  (34)| 00:00:01 |
|   7 |      VIEW                      | index$_join$_002 |    27 |   189 |     2   (0)| 00:00:01 |
|*  8 |       HASH JOIN                |                  |       |       |            |          |
|   9 |        INDEX FAST FULL SCAN    | DEPT_ID_PK       |    27 |   189 |     1   (0)| 00:00:01 |
|  10 |        INDEX FAST FULL SCAN    | DEPT_LOCATION_IX |    27 |   189 |     1   (0)| 00:00:01 |
|* 11 |    TABLE ACCESS FULL           | EMPLOYEES        |   103 |   721 |     3   (0)| 00:00:01 |
—————————————————————————————————
Query Block Name / Object Alias (identified by operation id):
————————————————————-
PLAN_TABLE_OUTPUT                                                                  
——————————————————————————————————————————-
   1 – SEL$1       
   4 – SEL$1        / C@SEL$1
   5 – SEL$1        / C@SEL$1
   7 – SEL$FD64DD72 / B@SEL$1
   8 – SEL$FD64DD72
   9 – SEL$FD64DD72 / indexjoin$_alias$_001@SEL$FD64DD72
  10 – SEL$FD64DD72 / indexjoin$_alias$_002@SEL$FD64DD72
  11 – SEL$1        / A@SEL$1
Outline Data
————-
PLAN_TABLE_OUTPUT
——————————————————————————————————————————-
  /*+
      BEGIN_OUTLINE_DATA
      USE_HASH(@”SEL$1″ “A”@”SEL$1”)
      USE_MERGE(@”SEL$1″ “B”@”SEL$1”)
      LEADING(@”SEL$1″ “C”@”SEL$1” “B”@”SEL$1” “A”@”SEL$1”)
      FULL(@”SEL$1″ “A”@”SEL$1”)
      INDEX_JOIN(@”SEL$1″ “B”@”SEL$1” (“DEPARTMENTS”.”DEPARTMENT_ID”)
              (“DEPARTMENTS”.”LOCATION_ID”))
      INDEX(@”SEL$1″ “C”@”SEL$1” (“LOCATIONS”.”LOCATION_ID”))
      OUTLINE_LEAF(@”SEL$1″)
      OUTLINE_LEAF(@”SEL$FD64DD72″)
      ALL_ROWS
      DB_VERSION(‘18.1.0’)
      OPTIMIZER_FEATURES_ENABLE(‘18.1.0’)
      IGNORE_OPTIM_EMBEDDED_HINTS
      END_OUTLINE_DATA
  */
Predicate Information (identified by operation id):
—————————————————
PLAN_TABLE_OUTPUT                                                                                                                                                                                             
——————————————————————————————————————————-
   2 – access(“A”.”DEPARTMENT_ID”=”B”.”DEPARTMENT_ID”)
   4 – filter(“C”.”POSTAL_CODE” IS NOT NULL)
   6 – access(“B”.”LOCATION_ID”=”C”.”LOCATION_ID”)
       filter(“B”.”LOCATION_ID”=”C”.”LOCATION_ID”)
   8 – access(ROWID=ROWID)
  11 – filter(“A”.”SALARY”>3000)
Column Projection Information (identified by operation id):
———————————————————–
   1 – (#keys=0) COUNT(*)[22]
PLAN_TABLE_OUTPUT  
——————————————————————————————————————————-
   2 – (#keys=1)
   3 – (#keys=0) “B”.”DEPARTMENT_ID”[NUMBER,22]
   4 – “C”.”LOCATION_ID”[NUMBER,22]
   5 – “C”.ROWID[ROWID,10], “C”.”LOCATION_ID”[NUMBER,22]
   6 – (#keys=1) “B”.”LOCATION_ID”[NUMBER,22], “B”.”DEPARTMENT_ID”[NUMBER,22]
   7 – “B”.”LOCATION_ID”[NUMBER,22], “B”.”DEPARTMENT_ID”[NUMBER,22]
   8 – (#keys=1) “B”.”DEPARTMENT_ID”[NUMBER,22], “B”.”LOCATION_ID”[NUMBER,22]
   9 – ROWID[ROWID,10], “B”.”DEPARTMENT_ID”[NUMBER,22]
  10 – ROWID[ROWID,10], “B”.”LOCATION_ID”[NUMBER,22]
  11 – “A”.”DEPARTMENT_ID”[NUMBER,22]
PLAN_TABLE_OUTPUT                                                                                     
——————————————————————————————————————————-
Note
—–
   – this is an adaptive plan
80 rows selected.
Ok, let’s try to digest this humongous output.
The very first part of the report is the Plan Hash Value. This is a unique identifier and will be very useful to differentiate this execution plan from others that the CBO can produce.
Plan hash value: 3098668569
The second part is the graphical representation of the execution plan itself. Here we can see each operation and its actual cost, rows, bytes and time.
—————————————————————————————————
| Id  | Operation                                                | Name              | Rows  | Bytes | Cost (%CPU)| Time |
—————————————————————————————————
|   0 | SELECT STATEMENT                                 |                                  |     1 |  24 |8 (13)| 00:00:01 |
|   1 |  SORT AGGREGATE                                  |                                  |     1 |  24 |            |          |
|*  2 |   HASH JOIN                                            |                                  |  102 |2448|8 (13)| 00:00:01 |
|   3 |    MERGE JOIN                                        |                                  |    27 | 459|5 (20)| 00:00:01 |
|*  4 |     TABLE ACCESS BY INDEX ROWID            | LOCATIONS                 |    22 | 220|2  (0)| 00:00:01 |
|   5 |      INDEX FULL SCAN                                | LOC_ID_PK                 |    23 |      |1   (0)| 00:00:01 |
|*  6 |     SORT JOIN                                          |                                  |    27 |189 |3  (34)|00:00:01 |
|   7 |      VIEW                                                 | index$_join$_002        |  27 |  189 |2 (0)| 00:00:01 |
|*  8 |       HASH JOIN                                        |                                  |      |                 |          |
|   9 |        INDEX FAST FULL SCAN                     | DEPT_ID_PK                |  27 |   189 |1(0)| 00:00:01 |
|  10 |        INDEX FAST FULL SCAN                     | DEPT_LOCATION_IX    |  27 | 189 |1 (0)| 00:00:01 |
|* 11 |    TABLE ACCESS FULL                             | EMPLOYEES                 |103 | 721 |3 (0)| 00:00:01 |
—————————————————————————————————
  
This graphical representation is very useful and most of the times it can quickly help us drill down any potential problems in the path. Still from here is kind of difficult to identify what is the order the CBO is joining these 3 tables (well, is not actually difficult but imagine if you are joining 50 of them).
The next section is the text representation of the execution plan.  

PLAN_TABLE_OUTPUT
——————————————————————————————————————————-
   1 – SEL$1       
   4 – SEL$1        / C@SEL$1
   5 – SEL$1        / C@SEL$1
   7 – SEL$FD64DD72 / B@SEL$1
   8 – SEL$FD64DD72
   9 – SEL$FD64DD72 / indexjoin$_alias$_001@SEL$FD64DD72
  10 – SEL$FD64DD72 / indexjoin$_alias$_002@SEL$FD64DD72
  11 – SEL$1        / A@SEL$1
From this is clear that is following C, B and then A.

Now comes the Outline Data. Outlines are just a collection of hints pertaining to each SQL statement. The CBO uses this collection to maintain the same execution plan for each has plan value.
Outline Data
————-
PLAN_TABLE_OUTPUT 
——————————————————————————————————————————-
  /*+
      BEGIN_OUTLINE_DATA
      USE_HASH(@”SEL$1″ “A”@”SEL$1”)
      USE_MERGE(@”SEL$1″ “B”@”SEL$1”)
      LEADING(@”SEL$1″ “C”@”SEL$1” “B”@”SEL$1” “A”@”SEL$1”)
      FULL(@”SEL$1″ “A”@”SEL$1”)
      INDEX_JOIN(@”SEL$1″ “B”@”SEL$1” (“DEPARTMENTS”.”DEPARTMENT_ID”)
              (“DEPARTMENTS”.”LOCATION_ID”))
      INDEX(@”SEL$1″ “C”@”SEL$1” (“LOCATIONS”.”LOCATION_ID”))
      OUTLINE_LEAF(@”SEL$1″)
      OUTLINE_LEAF(@”SEL$FD64DD72″)
      ALL_ROWS
      DB_VERSION(‘18.1.0’)
      OPTIMIZER_FEATURES_ENABLE(‘18.1.0’)
      IGNORE_OPTIM_EMBEDDED_HINTS
      END_OUTLINE_DATA
  */
Look how the LEADING hint is also showing the path (order) of the join, which is C, B and A.

LEADING(@”SEL$1″ “C”@”SEL$1” “B”@”SEL$1” “A”@”SEL$1”)
Does this mean that I can alter the execution plan by adding a hint and forcing the order to be A, B and C as original intended?

Well, let’s try it.

I’m going to explain below SQL:

explain plan SET statement_id = ‘ex_plan1’ for SELECT /*+ LEADING(@”SEL$1″ “A”@”SEL$1” “B”@”SEL$1” “C”@”SEL$1”) */
    COUNT(*)
FROM
    hr.employees a,
    hr.departments b,
    hr.locations c
WHERE
    a.department_id = b.department_id
    AND b.location_id = c.location_id
    AND a.salary > 3000
    AND c.postal_code IS NOT NULL;
And here are some pieces of the output:
PLAN_TABLE_OUTPUT
——————————————————————————————————————————-
Plan hash value: 2122977163
———————————————————————————————-
| Id  | Operation                 | Name             | Rows  | Bytes | Cost (%CPU)| Time     |
———————————————————————————————-
|   0 | SELECT STATEMENT          |                  |     1 |    24 |     8   (0)| 00:00:01 |
|   1 |  SORT AGGREGATE           |                  |     1 |    24 |            |          |
|*  2 |   HASH JOIN               |                  |    80 |  1920 |     8   (0)| 00:00:01 |
|*  3 |    HASH JOIN              |                  |    80 |  1120 |     5   (0)| 00:00:01 |
|*  4 |     TABLE ACCESS FULL     | EMPLOYEES        |    81 |   567 |     3   (0)| 00:00:01 |
|   5 |     VIEW                  | index$_join$_002 |    27 |   189 |     2   (0)| 00:00:01 |
|*  6 |      HASH JOIN            |                  |       |       |            |          |
|   7 |       INDEX FAST FULL SCAN| DEPT_ID_PK       |    27 |   189 |     1   (0)| 00:00:01 |
|   8 |       INDEX FAST FULL SCAN| DEPT_LOCATION_IX |    27 |   189 |     1   (0)| 00:00:01 |
|*  9 |    TABLE ACCESS FULL      | LOCATIONS        |    22 |   220 |     3   (0)| 00:00:01 |
———————————————————————————————-
Query Block Name / Object Alias (identified by operation id):
————————————————————-
   1 – SEL$1      
   4 – SEL$1        / A@SEL$1
   5 – SEL$FD64DD72 / B@SEL$1
   6 – SEL$FD64DD72
   7 – SEL$FD64DD72 / indexjoin$_alias$_001@SEL$FD64DD72
   8 – SEL$FD64DD72 / indexjoin$_alias$_002@SEL$FD64DD72
   9 – SEL$1        / C@SEL$1
Outline Data
————-
  /*+
      BEGIN_OUTLINE_DATA
PLAN_TABLE_OUTPUT 
——————————————————————————————————————————-
      USE_HASH(@”SEL$1″ “C”@”SEL$1”)
      USE_HASH(@”SEL$1″ “B”@”SEL$1”)
      LEADING(@”SEL$1″ “A”@”SEL$1” “B”@”SEL$1” “C”@”SEL$1”)
      FULL(@”SEL$1″ “C”@”SEL$1”)
      INDEX_JOIN(@”SEL$1″ “B”@”SEL$1” (“DEPARTMENTS”.”DEPARTMENT_ID”)
              (“DEPARTMENTS”.”LOCATION_ID”))
      FULL(@”SEL$1″ “A”@”SEL$1”)
      OUTLINE_LEAF(@”SEL$1″)
      OUTLINE_LEAF(@”SEL$FD64DD72″)
      ALL_ROWS
      DB_VERSION(‘18.1.0’)
      OPTIMIZER_FEATURES_ENABLE(‘18.1.0’)
      IGNORE_OPTIM_EMBEDDED_HINTS
      END_OUTLINE_DATA
  */
See now how the Hash Plan Value changed?

The execution plan and outline information also show that the order on how the CBO joined the tables changed from C, B and A to A, B and C.

Knowing how to read execution plans and the understanding of paths and outlines is really useful, especially in emergency situations where a sub-optimal plan is affecting production.

Thanks,
Alfredo

Exdata’s Cell Server Crashing

“RS-7445 [Serv CELLSRV hang detected] [It will be restarted] [] [] [] [] [] [] [] [] [] []”
“A kernel crash has caused the system to reboot.”
This ended up to be related to bug 25374245.
The workaround is to monitor the cell offload server resident memory and manually restart it before it gets above 40 GBs.
You can do this in rolling mode using below commands:
cellcli -e list griddisk attributes name,asmmodestatus,asmdeactivationoutcome
cellcli -e alter cell restart services cellsrv;
More information can be found in below MOS note:
Exadata Cell Node Crashed with memory starvation (Doc ID 2421920.1)
Thanks,
Alfredo

EBS ADOP Phase Failing Due to ORA-600 Error

There’s an issue in EBS 12.2 and database 12.1.0.2 versions related to Materialized Views. While executing ADOP (prepare, apply, finalize or cutover) phases, the cycle could fail due to an ORA-600 : internal error code, arguments: [kqllod:no stub for dependency parent] error.
After working with Oracle, they provided information about BUG 27883586 related to MView Refresh or Create while they are editioned.
The solution is to apply patch 27883586 to the database which is currently available for August 2017 release and then recreate the MViews. Oracle also released a merge patch on top if this (28820125).
If you need it for a different release, please contact Oracle to provide it.
Happy patching,
Alfredo

OEM 13c Reporting Incorrect Tablespace Space Usage (%) After July 2018 PSU

The topic for today is Tablespace monitoring. OEM 13c started reporting inaccurate values for the Space Usage (%) metric after applying either the April 2018 or the July 2018 Database PSU’s. The way this was detected, is that OEM 13c Corrective Actions started firing here and there after the patches.
Oracle confirmed this is tracked on BUG 26198757.
This patch is available on top of both the April 2018 and the October 2018 PSU’s but is not available for October 2018 PSU. The issue could also manifest itself as huge wait times on “Sync ASM rebalance” event.
Looks like the issue is corrected after applying the patch on top of July 2018 PSU. Below are some MOS realted to this.
Bug 26198757 – dba_tablespace_usage_metrics.used_percent is incorrect after applying 25397136 (Doc ID 26198757.8)
EM13c Space Monitoring Query (sqlid=69p6my4hpdm3j) On dba_tablespace_usage_metrics Timed Out after Db Upgraded To 12.2 (Doc ID 2375714.1)
EM 13c, 12.1.0.5: Enterprise Manager Cloud Control Tablespace Space Used (%) Metric Incorrectly Triggering (Doc ID 2313520.1)
DBA_TABLESPACE_USAGE_METRICS Returns Incorrect Information After applying 12.1.0.2.170418 (25397136) Bundle patch (Doc ID 2289448.1)
Thanks and happy patching,
Alfredo

RMAN Recovery Catalog Issues after 12.2 Upgrade

Well, after the upgrade of the DB to 12.2 the next step is to upgrade the RMAN Recovery Catalog to the same version in order to be able to run backups using it. The process is pretty straight forward.
.    Connect to RMAN using target and catalog
.    Execute upgrade catalog
RMAN> upgrade catalog;
This finishes correctly. But then we try to resync the catalog we got below error:
RMAN> resync catalog;
starting full resync of recovery catalog
RMAN-00571: ===========================================================
RMAN-00569: =============== ERROR MESSAGE STACK FOLLOWS ===============
RMAN-00571: ===========================================================
RMAN-03009: failure of resync command on default channel at 06/07/2018 22:15:36
ORA-01403: no data found
This is due to a bug 27013146. The solution is to apply this patch to the newly upgraded Oracle Home and re-run the upgrade catalog again.
More information can be found in MOS Note 2341947.1.
Everything is cool now, right? Well, now the old 12.1.0.2 database backups are failing with below error:
RMAN-03008: error while performing automatic resync of recovery catalog
For that, the solution is outlined in MOS Doc Id 2291791.1.
Happy 12.2 upgrades!
Thanks,
Alfredo

Exadata/Exacloud CellServer health using AWR report

Exadata’s unique sauce relies on the fact that the DB instance can offload work to the CellServers to speed up I/O bound queries. But how do you monitor the health of the CellServers?
A quick and dirty way, especially if you don’t have access to the CellServers is to use AWR in a database that’s currently using those CellServers. Let’s get an AWR report and search for the SMART IO section. It should look like this.

What you want to see here is that % Total MB Requested is evenly distributed across all Cells. The same applies for Storage Index and Flash Cache metrics.
Now this is the interesting part. If you happen to see the Offload % Efficiency dropping for one of the cells, that means that the Cell is sending the complete blocks back to the DB and then the % Passthru metric is going to increase.
You don’t really want the % Passthru to increase as this will have a direct performance is the DBs being served by this Cell.
What are the reasons of this Passthru increasing?
There are 3 reasons for Passthru.
The first one is due to an issue with the Cell itself. The second one is due to issues with DST patches and the third one is related to user queries crashing the Cell.
You should look at the below MOS note in order to gather all the required information and open an SR immediately after you see this behavior.
SRDC – Exadata: Smart Scan Not Working Issues (Doc ID 2310422.1)
Thanks,
Alfredo

Exalogic Agents being automatically deleted from OEM 13c

Oracle Enterprise Manager (OEM) 13c is capable of monitoring virtual guest hosts running on Exalogic (virtual configuration). OEM will connect (read-only) to the Oracle VM Manager and get the configuration and status of the VM’s running there. Then you can deploy an agent to those VM hosts and you have a complete monitoring solution for Exalogic.
The problem comes when for whatever reason you have to drop those VM’s from Exalogic but you want to keep the OEM configuration in place. For example, you want to drop the VM from Exalogic and then restore it from backup.
In this case you want to keep your monitoring configuration (metrics, credentials, etc.), but you realize that the agent was removed (along with all targets) as soon as you drop the VM from Exalogic.
This setup is being driven by metric like configuration. This synchronization is happening every minute by default.  This is covered on below Oracle’s document:
The solution was to set this synchronization schedule from every 1 minute to every 1 day.
Thanks,
Alfredo

Manage Your Oracle Cloud Database – SQL Developer

In my previous post (How To Connect To The Oracle Cloud Instance) we reviewed the steps to connect using SQL Developer. Now we will see what DBA tasks we can perform using SQL Developer.

First click on the View menu, then click on the DBA sub menu. This is going to open the DBA pane in the lower left corner.

Click on Connections and add the connection we already setup to the Oracle Cloud Instance. 


Here you can expand the tree to verify what is available from SQL Developer.

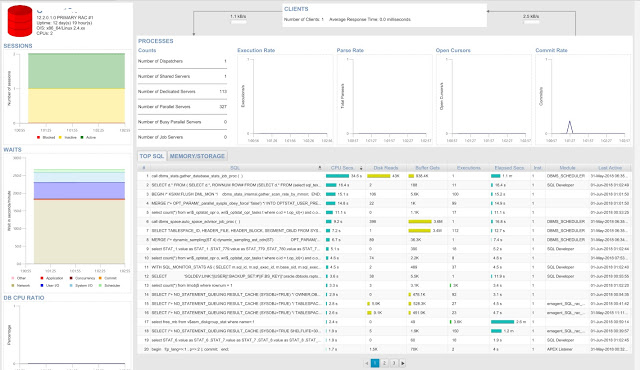
Let’s click on Tuning and then Real Time SQL Monitoring. The right pane is going to display the SQL Monitoring output. I’m really familiar to this feature in OEM 13c and honestly, looks very similar in SQL Developer.

Now let’s click on Instance Viewer under Database Status menu.
This is going to show you the overall container status and statistics on where our PDB is running on.


The storage menu can help you verify the size of your tablespaces and under RMAN Backup/Recovery you can verify that there are actually backups happening every night. 

Thanks,
Alfredo


How To Connect To The Oracle Cloud DB Instance?

In my previous post (How To Create An Oracle Cloud Instance) I showed you create your first Oracle Cloud DB instance. Now that the instance is there the question is, how to connect to it?

Let’s say you want to connect using SQL Developer to start creating objects and inserting data. First you need to enable the Client Access feature. Yes, it is disabled by default. 

Navigate to the Cloud DB instance dashboard. Click on Manage menu on the left side. 
Click on Admin Password and provide a password for the PDB_ADMIN account.

Then click on Client Access and check the enabled flag, then save.

It will show like this.


Once this is enabled you need to download the Access Credentials in order to connect to your instance.

Click on the Client Credentials button located on the right side of the Client Access one. This is going to prompt for a password (type one that you can remember) and it will download a .zip file containing these credentials and connect descriptors.

Note: You don’t have to unzip this file.

Open your SQL Developer software and click on New Connection.

Type a name for your connection. In the username & password you can either type the PDB_ADMIN username and password or the credentials for the newly created schema.

In Connection Type select Cloud PDB and provide the downloaded .zip file along with the password provided (the one that you should remember).  

It should look like this.


Click Save and then Connect.

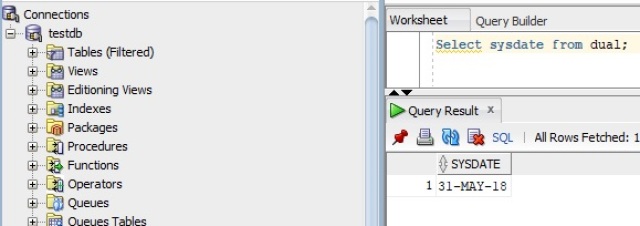
Now let’s test our connection by executing a simple SQL statement.


Using the Cloud DB instance dashboard you can create different schemas as needed.
You just provide the username and password.


At the end you just need to follow the same steps as we did before, just provide the username and password of the new schema.

More information can be found at:

https://docs.oracle.com/en/cloud/paas/exadata-express-cloud/csdbp/connecting-sql-developer.html#GUID-238A40BD-10E9-4478-AAA3-43FC98519D3F


Thanks,
Alfredo