How To Monitor Oracle DBs On Docker Containers With EM 13c

This post continues the thread of DevOps and automation for the Oracle Database. During the last couple of months I’ve seen more interest in deploying Oracle Databases on Docker containers. Even more now that Oracle released full support of RAC Databases running on Docker.


After you deploy your first Oracle Database on Docker, several questions come into mind; like:

  • How do I monitor the status of the Oracle Database?
  • How do I manage the performance of the Oracle Database and the SQL’s being executed on it?
  • How do I alert on issues on a timely manner?

Well, if you have the same questions or concerns… you are not alone!

On this post, I’m trying to explain the process I followed in order to deploy an Oracle Enterprise Manager agent on a Docker container and how I do monitor and manage the Oracle Database running on it.

First things first. Just a quick recap of my environment.

  • Oracle Linux 7 host running Docker 19.03
  • Create a MACVLAN network on Docker. My network adapter is ens3 on the host running Docker.
sudo docker network create -d macvlan --subnet=192.168.56.0/24 --gateway=192.168.56.1 -o parent=ens3 orcl_nw
  • Create a Docker volume type “nfs” using an NFS share named /NFSSHARE
sudo docker volume create --driver local --opt type=nfs --opt o=addr=<nfs server>,rw,bg,hard,tcp,vers=3,timeo=600,rsize=32768,wsize=32768,actimeo=0 --opt device=:/NFSSHARE agentstorage
  • Pull the 19.3 Docker image from container-registry.oracle.com
sudo docker pull container-registry.oracle.com/database/enterprise:19.3.0.0
  • Create the Docker container using the recently pulled image and mounting the volume “agentstorage” into “/u01” inside the container
sudo docker create -t -i \
--name ol7-orcl --hostname ol7-orcl --user oracle --ip 192.168.56.101 \
-e ORACLE_SID=ORCL \
-e ORACLE_PDB=PDB1 \
-v agentstorage:/u01 \
container-registry.oracle.com/database/enterprise:19.3.0.0
  • Disconnect the bridged Docker network from the container
sudo docker network disconnect bridge ol7-orcl
  • Connect the container to the MACVLAN network
sudo docker network connect orcl_nw --ip 192.168.56.101 ol7-orcl
  • Start our Docker container
sudo docker start ol7-orcl
  • Review the startup process and the creation of the database
sudo docker logs -f ol7-orcl

At this point we have our Docker container and the ORCL database up and running. But now I need a way to connect my ORCL database to the external world. Because I’m running a MACVLAN, I can create another Docker container in the same network and install Oracle Enterprise Manager (EM) in order to monitor it. Or I can also install Oracle EM on the host running Docker and setup a network link and a route to my Docker container. Let’s do the second option.

sudo ip link add mydocker-net link ens3 type macvlan mode bridge
sudo ip addr add 192.168.56.1/32 dev mydocker-net
sudo ip link set mydocker-net up
sudo ip route add 192.168.56.0/24 dev mydocker-net

I now have connectivity between my host and the Docker container.

$ ping 192.168.56.101
PING 192.168.56.101 (192.168.56.101) 56(84) bytes of data.
64 bytes from 192.168.56.101: icmp_seq=1 ttl=64 time=0.056 ms
64 bytes from 192.168.56.101: icmp_seq=2 ttl=64 time=0.070 ms
64 bytes from 192.168.56.101: icmp_seq=3 ttl=64 time=0.062 ms
64 bytes from 192.168.56.101: icmp_seq=4 ttl=64 time=0.073 ms
64 bytes from 192.168.56.101: icmp_seq=5 ttl=64 time=0.070 ms

sh-4.2$ ping 192.168.56.1
PING 192.168.56.1 (192.168.56.1) 56(84) bytes of data.
64 bytes from 192.168.56.1: icmp_seq=1 ttl=64 time=0.064 ms
64 bytes from 192.168.56.1: icmp_seq=2 ttl=64 time=0.079 ms
64 bytes from 192.168.56.1: icmp_seq=3 ttl=64 time=0.043 ms
64 bytes from 192.168.56.1: icmp_seq=4 ttl=64 time=0.082 ms
64 bytes from 192.168.56.1: icmp_seq=5 ttl=64 time=0.077 ms

The next step is to have name resolution setup between both hosts. For the Docker container it was easy to setup the full host name into the external DNS service. For the host resolution inside the Docker container you can use static entries in the /etc/hosts file or use the Docker embedded DNS server. For my exercise, I setup an entry in my /etc/hosts file providing the host name and the IP address of the host where EM is running.

The rest of the process is very straight forward. I use the silent install option for the Oracle EM agent. Below link has the steps to download the agent binaries for your specific platform and version.


Once you have the ZIP file of the agent binaries. Then just copy it inside the NFS share and connect to the Docker container.

sudo docker exec -it --user oracle ol7-orcl /bin/sh

After you login to the container just follow the steps in the provided agent install guide. Update the response file with the required information and run agentDeploy.sh. Make sure that the Agent Home resides in the Docker volume created. For this exercise will be inside /u01 directory.

After the agent deploy succeeds disconnect from the Docker session and re-connect as root.

sudo docker exec -it --user root ol7-orcl /bin/sh

Execute root.sh inside the Agent Home directory.

Let’s now verify that our EM has a new host target named ol7-orcl and is up and running.

Docker Container ol7-orcl on Oracle Enterprise Manager

The next step is to discover the ORCL database in EM. You can change the DBSNMP password by logging to the Docker container, then use SQLPlus to change the password and unlock the account.

alter user dbsnmp identified by <password> account unlock;

After the database discovery, verify the database target in the EM console.

ORCL database home page

Now that you have both the host target and the database target you can set metrics, thresholds and notifications on them.

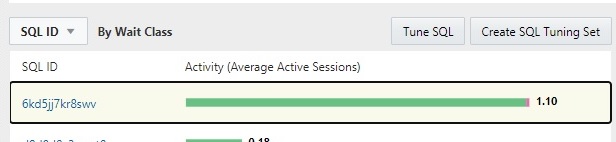
Another important option is that if you have Diagnostics and Tuning packs, you can also monitor performance, get AWR/ASH reports and use EM to graphically analyze performance issues.

ORCL performance information

Hope this post helps understand the options you have in order to setup the required monitoring for the Oracle databases running on Docker containers.

Thanks,
Alfredo

Oracle Enterprise Manager 13c Snap Clone Demo

The database cloning process can be often time consuming, resource intensive and expensive especially for large multi-terabyte databases. This can lead to miss project deadlines or to cause that storage costs grow out of control.

Enterprise Manager 13c Snap Clone instant database cloning allows administrators to create fully functional copies of databases using the capabilities of the underlying storage layer. Snap Clone is also capable to use Data Masking Definitions in order to securely manage test data.

Below video is a demonstration on how to setup Snap Clone with the ZFS storage appliance in order to clone either single instance or pluggable databases (PDBs).

For additional information about Snap Clone capabilities click below.


Thanks,
Alfredo

Oracle Enterprise Manager App for Grafana

Oracle Enterprise Manager 13c provides out-of-box dashboard functionality, so you can see the status of all your targets on a single screen. You also have information about target’s fatal, critical, warning and escalated incidents along with detailed information about them.

But what about additional data that EM is already collecting? What if you create Metric Extensions and you want to display them in the dashboard?

Oracle Enterprise Manager App for Grafana was just released last month. This Grafana plug-in allows you directly connect from Grafana to Oracle Enterprise Manager and make use of the already collected data in order to create custom dashboards.


In this post I want to guide you through the process of installing a test Grafana server and connect that to Oracle Enterprise Manager.

First things first, you need to make sure you install Grafana 6.6.2 or higher and you have Oracle Enterprise Manager 13.4 RU 3 or higher. Let’s now jump into the installation process.

I have a small VM running OL7. I assinged 2 CPUs and 8 GB of RAM. The next step is to install Grafana in the VM.

$ wget https://dl.grafana.com/oss/release/grafana-7.0.5-1.x86                                                                                                                                                                                                                                             _64.rpm
--2020-06-30 19:36:01--  https://dl.grafana.com/oss/release/grafana-7.0.5-1.x86_                                                                                                                                                                                                                                             64.rpm
Resolving dl.grafana.com (dl.grafana.com)... 151.101.138.217, 2a04:4e42:46::729
Connecting to dl.grafana.com (dl.grafana.com)|151.101.138.217|:443... connected.
HTTP request sent, awaiting response... 200 OK
Length: 49118311 (47M) [application/x-redhat-package-manager]
Saving to: ‘grafana-7.0.5-1.x86_64.rpm’

100%[======================================>] 49,118,311   232MB/s   in 0.2s

2020-06-30 19:36:02 (232 MB/s) - ‘grafana-7.0.5-1.x86_64.rpm’ saved [49118311/49                                                                                                                                                                                                                                             118311]
$ sudo yum install grafana-7.0.5-1.x86_64.rpm
Loaded plugins: langpacks, ulninfo
Examining grafana-7.0.5-1.x86_64.rpm: grafana-7.0.5-1.x86_64
Marking grafana-7.0.5-1.x86_64.rpm to be installed
Resolving Dependencies
--> Running transaction check
---> Package grafana.x86_64 0:7.0.5-1 will be installed
--> Processing Dependency: fontconfig for package: grafana-7.0.5-1.x86_64
--> Processing Dependency: urw-fonts for package: grafana-7.0.5-1.x86_64
...
--> Running transaction check
---> Package libXau.x86_64 0:1.0.8-2.1.el7 will be installed
--> Finished Dependency Resolution

Dependencies Resolved

================================================================================
 Package                              Arch   Version         Repository    Size
================================================================================
Installing:
 grafana                              x86_64 7.0.5-1         /grafana-7.0.5-1.x8                                                                                                                                                                                                                                             6_64
                                                                          143 M
Installing for dependencies:
 ...
Installed:
  grafana.x86_64 0:7.0.5-1

Complete!

Now is time to start Grafana server in the VM.

$ sudo systemctl daemon-reload
$ sudo systemctl start grafana-server
$ sudo systemctl status grafana-server
● grafana-server.service - Grafana instance
   Loaded: loaded (/usr/lib/systemd/system/grafana-server.service; disabled; vendor preset: disabled)
   Active: active (running) since Tue 2020-06-30 19:40:40 GMT; 1s ago
 ...
lvl=info msg="External plugins directory created" logger=plugins directory=/var/lib/grafana/plugins
Jun 30 19:40:40 grafana-s02 systemd[1]: Started Grafana instance.
Jun 30 19:40:40 grafana-s02 grafana-server[11614]: t=2020-06-30T19:40:40+0000 lvl=info msg="HTTP Server Listen" logger=http.server address=[::]:3000 protocol=http subUrl= socket=

Let’s now login to our Grafana server installation. By default the port assigned is 3000, so the URL will be similar to http://<grafana_server>:3000

Grafana Welcome Page

The default credentials are admin/admin. Grafana will ask you to change the admin password right after the first login.

The next step is to download and install the Oracle Enterprise Manager App for Grafana. You can find the download link and documentation below.


There are 2 methods for installing the EM App for Grafana:

  • Using CLI (grafana-cli)
  • Without CLI

For my test, I’m going to install the EM App for Grafana without using the CLI.

$ sudo mv oracle-emcc-app-1.0.2.zip /var/lib/grafana/plugins/
$ sudo unzip /var/lib/grafana/plugins/oracle-emcc-app-1.0.2.zip
Archive:  oracle-emcc-app-1.0.2.zip
   creating: oracle-emcc-app-1.0.2/
   creating: oracle-emcc-app-1.0.2/datasource/
  inflating: oracle-emcc-app-1.0.2/datasource/query_ctrl.js
  inflating: oracle-emcc-app-1.0.2/datasource/Response.js
  inflating: oracle-emcc-app-1.0.2/datasource/EMCCConstants.js
  inflating: oracle-emcc-app-1.0.2/datasource/plugin.json
  inflating: oracle-emcc-app-1.0.2/datasource/QueryResource.js
   creating: oracle-emcc-app-1.0.2/datasource/img/
  inflating: oracle-emcc-app-1.0.2/datasource/img/em_logo.png
  inflating: oracle-emcc-app-1.0.2/datasource/module.js
  inflating: oracle-emcc-app-1.0.2/datasource/BaseQueryResource.js
  inflating: oracle-emcc-app-1.0.2/datasource/MetricQueryResource.js
  inflating: oracle-emcc-app-1.0.2/datasource/Utils.js
  inflating: oracle-emcc-app-1.0.2/datasource/config_ctrl.js
  inflating: oracle-emcc-app-1.0.2/datasource/datasource.js
   creating: oracle-emcc-app-1.0.2/datasource/partials/
  inflating: oracle-emcc-app-1.0.2/datasource/partials/query.editor.html
  inflating: oracle-emcc-app-1.0.2/datasource/partials/config.html
  inflating: oracle-emcc-app-1.0.2/datasource/partials/annotation.editor.html
  inflating: oracle-emcc-app-1.0.2/plugin.json
  inflating: oracle-emcc-app-1.0.2/README.md
   creating: oracle-emcc-app-1.0.2/img/
  inflating: oracle-emcc-app-1.0.2/img/em_logo.png
   creating: oracle-emcc-app-1.0.2/components/
  inflating: oracle-emcc-app-1.0.2/components/config.js
   creating: oracle-emcc-app-1.0.2/components/partials/
  inflating: oracle-emcc-app-1.0.2/components/partials/config.html
  inflating: oracle-emcc-app-1.0.2/module.js
   creating: oracle-emcc-app-1.0.2/dashboards/
  inflating: oracle-emcc-app-1.0.2/dashboards/template_single_em_single_target_type_single_target_name_single_named_credential.json
  inflating: oracle-emcc-app-1.0.2/dashboards/template_single_em_single_target_type_single_target_name.json
  inflating: oracle-emcc-app-1.0.2/dashboards/template_single_em_single_target_type.json
  inflating: oracle-emcc-app-1.0.2/dashboards/template_multi_em.json
  inflating: oracle-emcc-app-1.0.2/dashboards/database_performance_report.json
  inflating: oracle-emcc-app-1.0.2/dashboards/template_single_em_single_target_type_multi_target_name.json
  inflating: oracle-emcc-app-1.0.2/dashboards/database_configuration_report.json
  inflating: oracle-emcc-app-1.0.2/dashboards/template_single_em.json

We now have to restart Grafana server.

$ sudo systemctl restart grafana-server
$ sudo systemctl status grafana-server
● grafana-server.service - Grafana instance
   Loaded: loaded (/usr/lib/systemd/system/grafana-server.service; disabled; vendor preset: disabled)
  ...
Jul 01 16:21:11 grafana-s02 systemd[1]: Started Grafana instance.
Jul 01 16:21:11 grafana-s02 grafana-server[5675]: t=2020-07-01T16:21:11+0000 lvl=info msg="HTTP Server Listen" logger=http.server address=[::]:3000 protocol=http subUrl= socket=

The EM App for Grafana has been installed, now we need to enable it and start using it. Before we do that we need to also enable it in our EM installation first. There 3 emctl command that we need to execute:

$ emctl set property -name oracle.sysman.db.restfulapi.grafana.enable -value true -sysman_pwd ********
Oracle Enterprise Manager Cloud Control 13c Release 4
Copyright (c) 1996, 2020 Oracle Corporation.  All rights reserved.
Property oracle.sysman.db.restfulapi.grafana.enable has been set to value true for all Management Servers
OMS restart is not required to reflect the new property value

$ emctl set property -name oracle.sysman.db.restfulapi.grafana.executesql.repository.query.enable -value true -sysman_pwd ********
Oracle Enterprise Manager Cloud Control 13c Release 4
Copyright (c) 1996, 2020 Oracle Corporation.  All rights reserved.
Property oracle.sysman.db.restfulapi.grafana.executesql.repository.query.enable has been set to value true for all Management Servers
OMS restart is not required to reflect the new property value

$ emctl set property -name oracle.sysman.db.restfulapi.grafana.executesql.target.query.enable -value true -sysman_pwd ********
Oracle Enterprise Manager Cloud Control 13c Release 4
Copyright (c) 1996, 2020 Oracle Corporation.  All rights reserved.
Property oracle.sysman.db.restfulapi.grafana.executesql.target.query.enable has been set to value true for all Management Servers
OMS restart is not required to reflect the new property value

Login back to the Grafana server and navigate to Configuration -> Plugins. Scroll down and look for Oracle Enterprise Manager App and click on the Plugin. You will see a button to “Enable” the plugin.

Enable Oracle Enterprise Manager App Plugin

Now is time to configure our Grafana datasource to connect to our Oracle Enterprise Manager installation. Navigate to Configuration -> Data Sources. Click on “Add data source” button. Scroll down and look for Oracle Enterprise Manager. Click on that and fill the required parameters:

  • Name
  • URL
  • User (do not use SYSMAN)
  • Password

Now click on “Save & Test” and look for a confirmation.

In order to verify that our Oracle Enterprise Manager App for Grafana is working properly we can open one of the sample dashboards. Let’s navigate to Dashboards -> Manage and click on the “Sample – Database Performance Report” dashboard. You should see something similar as below.

Sample Grafana – EM Dashboard

You can copy these sample dashboards and adjust them for your needs. You may also develop your own dashboards by querying all the Repository Views that EM exposes as part of the extensibility framework.

Hope this provides some guidance on how to deploy the Oracle Enterprise Manager App for Grafana.

Thanks,
Alfredo

Finding the Weblogic Password for the Oracle Enterprise Manager Marketplace Image

Oracle Enterprise Manager (EM) 13.4 is available in the Oracle Cloud Infrastructure Marketplace. This image is very flexible and allows you to choose between different EM Deployment sizes ranging from Simple (Single node) to Large (Multi-node) setups.

I decided to deploy a Simple configuration in order to test it out. The deployment wizard prompts you for several passwords including the Enterprise Manager (sysman), Agent registration, Database password, etc. But it never asks for the Weblogic console password. I first thought that the Weblogic console and Enterprise Manager (sysman) password were going to be the same, but for my surprise they weren’t.

The Marketplace image comes with RU 2 deployed and I need to apply the latest RU 3 to this Oracle EM installation and I must know the Weblogic console username and password in order to accomplish this.

In one of my previous posts, I explained how to apply this RU 3 to Oracle EM.


So, the question now is… What are the username and password for the Weblogic console? Is there any way to change them if I don’t know them?

There’s an MOS note available that explains how to change these passwords when the current password is known.

EM 12c , EM 13c: Steps for Modifying the Password for Weblogic and Nodemanager User Accounts in the Enterprise Manager Cloud Control Installation (Doc ID 1450798.1)

But in this case, I don’t know it. For some reason I remembered that someone posted a way to decrypt this password many years ago when we were running EM 12c. I’m glad that the browser search came back with the result I was looking for. Gokhan Atil posted the method in 2015. Below is the link to his post.


Now is time to follow the steps and find that needed password.

[oracle@oms1 em]$ cd /u01/app/oracle/em/gc_inst_134/user_projects/domains/GCDomain/
[oracle@oms1 GCDomain]$ cat servers/EMGC_ADMINSERVER/security/boot.properties
# Generated by Configuration Wizard on Sat May 09 09:30:41 GMT 2020
username={AES}oK4uyE6/MrBQd+38zr+wSk5y4vTMkQjB19ZOri4sDOI=
password={AES}hUM4t0cbEIJRuluMPxGBN3yGom1M9jwxEhNeGByu+8vTnmbG+xOTR
[oracle@oms1 GCDomain]$ vi recoverpassword.java
#####Insert this content#######
public class recoverpassword {
 public static void main(String[] args)
 {
  System.out.println(
  new weblogic.security.internal.encryption.ClearOrEncryptedService(
  weblogic.security.internal.SerializedSystemIni.getEncryptionService(args[0]
   )).decrypt(args[1]));
  }
}
#####Code ends here#########
[oracle@oms1 GCDomain]$ . bin/setDomainEnv.sh
[oracle@oms1 GCDomain]$ javac recoverpassword.java
[oracle@oms1 GCDomain]$ java -cp $CLASSPATH:. recoverpassword \
> $DOMAIN_HOME {AES}oK4uyE6/MrBQd+38zr+wSk5y4vTMkQjB19ZOri4sDOI=
weblogic
[oracle@oms1 GCDomain]$ java -cp $CLASSPATH:. recoverpassword \
> $DOMAIN_HOME {AES}hUM4t0cbEIJRuluMPxGBN3yGom1M9jwxEhNeGByu+8vTnmbG+xOTR
*************

Voila! Now I have both the username and password for the Weblogic console. Now I can proceed and apply the RU 3 to the OMS instance.

Thanks and happy patching!
Alfredo

Oracle Enterprise Manager Performance Hub

Oracle Enterprise Manager (EM) 13.4 RU 2 has just been released this month. You may noticed that starting from EM 13.3 PG, the Top Activity page has been decommissioned. The Performance Hub page is the one that is available and yes, is not using Flash. If you have concerns about no longer having access to your EM Flash based graphs once the Web browsers stop supporting it, then your best bet is to upgrade your EM system.


Let’s talk about the features available on the Performance Hub page.

First of all, keep in mind that this page requires the Database Diagnostics and Tuning packs. All the data used by this page is provided thanks to Oracle’s instrumentation and stored in the Automatic Workload Repository (AWR). In order to open the Performance Hub page, from the Database Home page navigate to Performance -> Performance Hub -> ASH Analytics.

Oracle Enterprise Manager Performance Menu
ASH Analytics Home Page

I’m dividing the ASH Analytics Home page into 5 main sections:

  1. Performance Hub main timeline (red)
  2. Tab selection between ASH Analytics and SQL Monitoring (blue)
  3. Average Active Sessions graph (yellow)
  4. SQL ID breakdown information (purple)
  5. User Session breakdown information (green)

The Performance Hub main timeline shows the current database performance divided in three classes; CPU utilization, User I/O and Wait. You may try to relate this to the old Top Activity graph, this one has additional functionality though.

Using ASH analytics you can customize your performance analysis by adjusting the timeline selector. Remember that in the Top Activity page this was fixed to 5 minutes.

Customize Your Performance Analysis

This becomes real handy when you try to isolate performance issues in the database. Once you select the desired timeline for you analysis, the bottom of the page will update based on you selection. Only data data falls under you selection will be displayed in sections 3,4 and 5.

On top of this, we still have the classic time related selectors and page refresh rate.

Page Refresh Rate – Time Selector

Using the tab selector you can quickly switch between ASH Analytics and SQL Monitoring.

Tab Selector

If you click on SQL Monitoring, sections 3, 4 and 5 of the ASH analytics page will be replaced with the SQL Monitoring session information table. Keep in mind that the information showed in the table will be limited by the timeline selector that we already discussed. Adjust you selection accordingly.

SQL Monitoring

Let’s now move to the Average Active Sessions section. This section displays detailed information of the current active sessions in the database during the selected period of time. You have the flexibility to adjust the graph by changing the graph’s dimensions. By default the graph will use the Wait Class a the main dimension.

Average Active Sessions

Apart of that you can also adjust the Maximum CPU limit line to show the limit based on the number of CPU’s, the number of CPU cores or you may decide to not show the limit at all.

Maximum CPU Limit Line

Another option is to only show foreground sessions (default) or to also include background sessions. You can even choose on whether show the standard load graph or to switch into a heat map like chart and select as many dimensions as needed.

Average Active Sessions Heat Map

The bottom of the page will display two tables. The one on the left side will show all the SQL information and the one on the right side the session information. You should be pretty familiar with these as the old Top Activity page was showing them as well.

You can also customize the view of these two tables and adjust the dimension. By default is set to the Wait Class.

SQL ID Dimension Selector

Last but not least is the ability to select a SQL ID from the table and either call SQL Tuning advisor or to create a SQL Tuning Set from the same page.

SQL Tuning Advisor / SQL Tuning Set Buttons

As you can see, this is not the old Top Activity page that we were used to, but definitively has more features and offers way more flexibility while working on monitoring or when trying to spot performance issues in the database.

Thanks,
Alfredo

Using SPA To Validate Changes

Oracle SQL Performance Analyzer (SPA) is part of Real Application Testing pack. We can use SPA to validate changes made to the database system. Some of these changes include gathering statistics, creating SQL Profiles or making parameter changes.

In one of my previous posts I provided detailed information on how to use SPA.


The video below provides better context and flow on how to use SPA to validate if a SQL Profile works as expected.

Using SPA to validate a SQL Profile

Thanks,
Alfredo

Bye Bye Flash!

Formerly named Macromedia Flash (now Adobe Flash) player was really popular in the 2000’s. I remember learning it to add animation to Web Sites I was developing during my college years. Flash has also been the target of hackers to insert viruses, hence posing several security concerns to enterprises and home users.

In the IT world, change is the only constant. So, is time to move on to the next thing.

Adobe Flash is widely used in several Oracle sites. My Oracle Support, Oracle Business Intelligence EE, Oracle Enterprise Manager Cloud Control, etc.
Google just announced that it will stop supporting Flash in Google Chrome at the end of 2020.

https://blog.google/products/chrome/saying-goodbye-flash-chrome/

That means that you will loose all those fancy graphs in your browser. Well, not quite. Oracle started to provide patches and upgrades to get rid of Adobe Flash and use JET instead.

We still have more than a year for this to happen, but is the perfect time to start planning to switch. Is this already in your plans?

Thanks,
Alfredo

Oracle Enterprise Manager 13.3 problems discovering Exadata targets

If you are on the latest Exadata plugin for EM 13.3 (well, even the 13.2 version of the plugin). Be aware that there’s a bug where if the Exadata nodes’ names are longer than 7 characters, you cannot discover them.

EM just throws a weird error with below legend:

SEVERE: makeTargetsXml for each rack#: 1 e=java.lang.StringIndexOutOfBoundsException: String index out of range: -1 

The solution is to apply the latest (March 2019) Bundle Patch to the agents running on the Exadata’s compute nodes.

More info on below MOS note:  

Exadata Discovery Fails With “No New Component Is Discovered. Click Cancel” (Doc ID 2477624.1)  

Another good excuse to keep your EM system up to date.  

Happy patching.  

Thanks,
Alfredo

OEM 12c Agent Crashing on Solaris

I recently had an issue with an OEM agent 12.1.0.4 version running on Solaris. Looks like there’s a Java related bug which causes the agent to consume high amounts of CPU in the box. But the interesting part is this only happens when Listeners are being monitored. If you blackout the Listener targets this stops.
If this’s the case then you are hitting Bug 15953286.
The solution is comprised by various steps outlined on MOS “EM 12c: Enterprise Manager 12c Cloud Control Agent CPU Spiking and High Utilization on Solaris with Many Database and Listener Targets (Doc ID 1536871.1)”.
Thanks,
Alfredo